2557

What Do I Blog About?

Admittedly, coming up with a blog post can be a challenge for me. After years of teaching online and as a student in graduate school (two masters and a doctorate degree), I have a hard time making myself read or write anything that isn’t absolutely required. As I mentioned in my previous posts on blogging,[...]

2555

How Should I Blog?

In my initial post on blogging (Do I Need to Blog?) I concluded that blogging is a good way to document the lessons I’ve learned on topics that interest me. This post thus briefly explains some important lessons about what platforms are available and why I chose to install WordPress on my own host. The[...]

2537a

Do I Need to Blog?

Frankly I’ve struggled with this question for a long time and although my gut says yes, I should have a blog given I’m an IT professional and professor who has a lot to offer, I can’t help thinking how I’ve managed to get along without one for decades. Admittedly, this is the third or may[...]

2393

An Online Market for Learning Crafts

Rosman, K. (2013, January 03). Made by hand, learned online – to master home-spun skills, tens of thousands of women are signing up for craftsy’s interactive classes. The Wall Street Journal, p. D1.

People, mostly women, are increasingly willing to pay to take online courses to learn to quilt, sew, and bake, among other things.

2390

To Build E-Commerce Apps and Sites, Young and Old are Learning to Code

Chen, A. (2014, March 12). It’s time to crack the code – to build apps and websites, kids and executives go to school; getting to know ruby. The Wall Street Journal, p. D1.

Parents of school-aged children along with young adults and experienced professionals are increasingly recognizing that the ability to code is as essential to being marketable in today’s technical society as are the abilities to read and write.

Heatmap

Heatmap

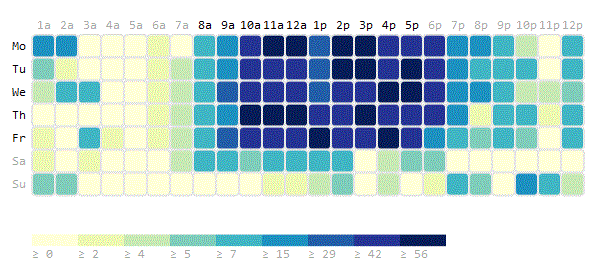
An example of a Day/Hour Heatmap showing concurrent user sessions over time in a development environment. It was generated with WP-D3 v2.1.1 and adapted from http://figurebelow.com/d3/wp-d3-and-day-hour-heatmap/. [d3-source canvas="wpd3-723-0"] [print-me]

Pie Chart

Pie Chart

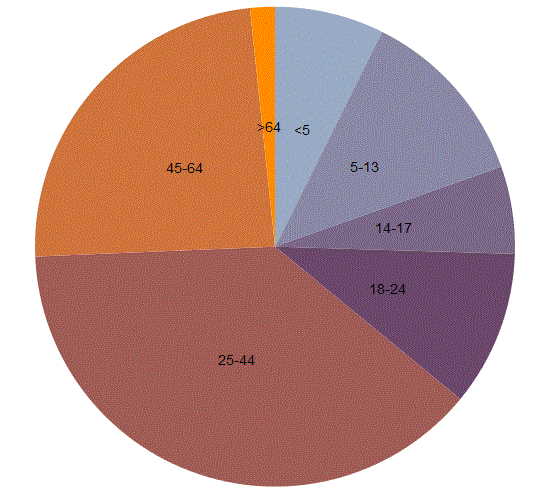
This example pie chart shows the relative size of various age groups. It was adapted to work in WP-D3 v. 2.1.1 from the original located at http://figurebelow.com/2013/03/13/wp-d3-tutorial-adding-d3-snippet-into-a-wordpress-post/ [d3-source canvas="wpd3-715-0"] [print-me]

Line Chart

Line Chart

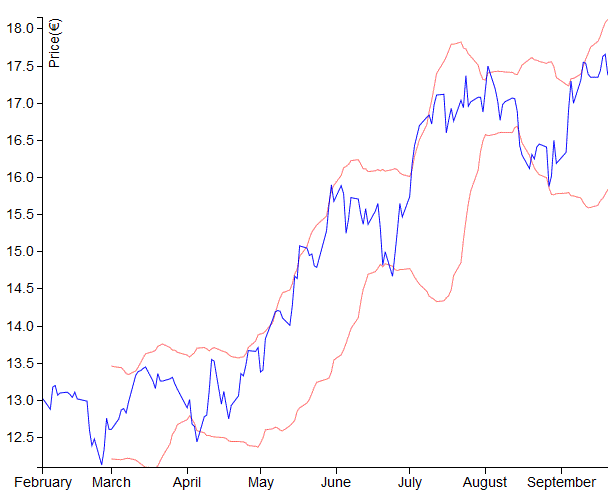
This demo chart contains the stock and Bollinger Bands (red) of Ford stocks (blue) between 1-Feb-2013 and 31-Jan-2014 and was adapted from the original located at http://figurebelow.com/d3/short-tutorial-into-wp-d3-v2/. [d3-source canvas="wpd3-709-0"] [print-me]

Box Plot

Box Plot

A box-and-whisker plot uses simple glyphs that summarize a quantitative distribution with five standard statistics: the smallest value, lower quartile, median, upper quartile, and largest value. This summary approach allows the viewer to easily recognize differences between distributions.

Frequency Bar Chart

Frequency Bar Chart

This simple bar chart originally by Mike Bostock is constructed from a TSV file storing the frequency of letters in the English language. The chart uses the following D3 features: d3.tsv – loads and parses data from a tab separated file d3.format – format percentages d3.scale.ordinal – x-position encoding d3.scale.linear – y-position encoding d3.max -[...]