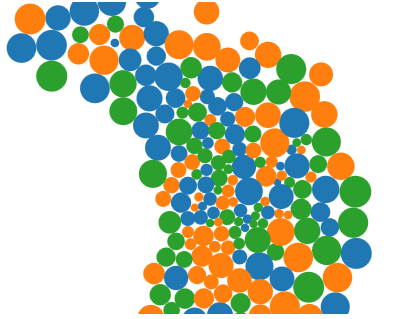
Collision Detection
An example of a D3 script that detects the collision of objects. [d3-source canvas=”wpd3-325-0″] [print-me]
An example of a D3 script that detects the collision of objects. [d3-source canvas=”wpd3-325-0″] [print-me]
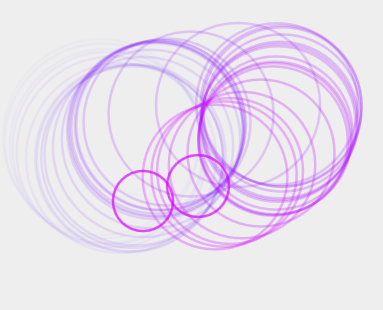
Generate particles with your mouse. [d3-source canvas=”wpd3-316-0″] [print-me]
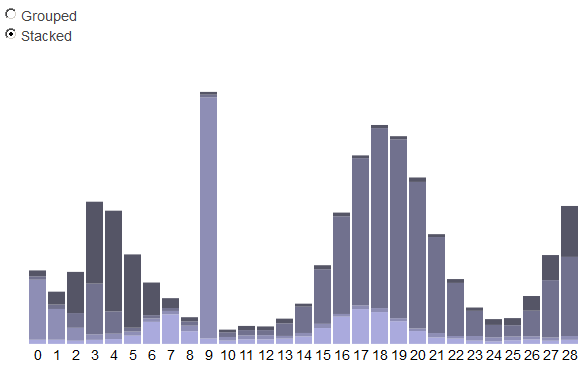
Switch between stacked and grouped layouts using sequenced transitions! Animations preserve object constancy and allow the user to follow the data across views. Animation design by Heer and Robertson. Colors and data generation inspired by Byron and Wattenberg.
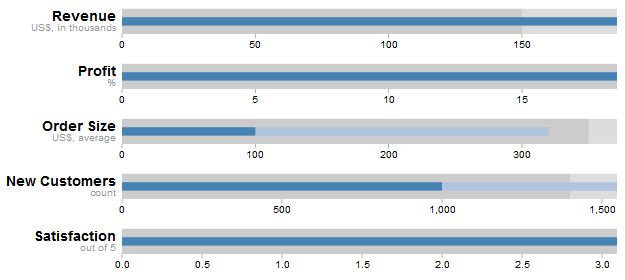
Designed by Stephen Few, a bullet chart “provides a rich display of data in a small space.” A variation on a bar chart, bullet charts compare a given quantitative measure (such as profit or revenue) against qualitative ranges (e.g., poor, satisfactory, good) and related markers (e.g., the same measure a year ago). [d3-source canvas=”wpd3-223-0″] [print-me]