Analytical Reports
Enough data was captured to do some basic analysis namely that of calculating the average price of books in a given category. An example of the average price of e-books is shown in Figure 5. Time data is not shown due to its length (y-m-d-h-m-s), but the fluctuation represents scrapes of e-books in the programming category every hour for a twelve-hour period.
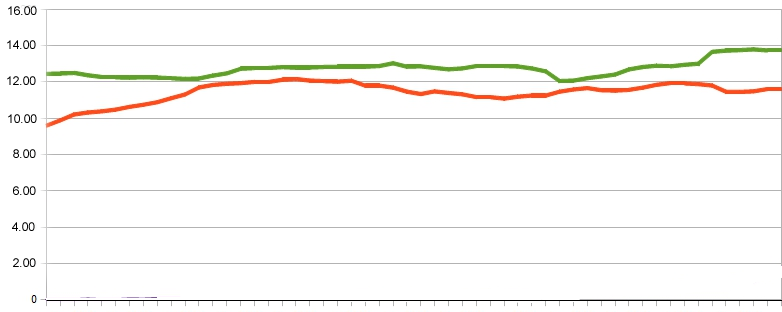
Figure 5: Average Price
Other analysis is possible including the change in rankings of a particular title or author over time along with interactive visualizations using additional extensions such as the JavaScript data-driven document library (D3), though is beyond the scope of this project.